Advanced Data Visualization Tools using Javascript

With the advance in computer graphics, the way we visualize data have changed drastically in the last 20 years. Visualization Software are developed to take advantage of the graphical power of local computers. But now everything is changing with the Internet. We are consuming a large amount of data online and the desire and expectation to visualizing those data is increasing too. So we need to look at solutions to visualize data for the web.
There are already server side tools or libraries that generate complex graphics. But I think that is not always the best solution. A lot of the visuals could be done on the client side with the browser. It is quite logical to send just the data and let the browser handle the rendering and interaction.
Of course there are a number of client side technology you could use including Flash, Sliverlight, or even Java Applet. But here I want to show you some amazing open source tools built with pure Javascript. With most of the browsers improving their Javascript engines, Javascript is really becoming quite powerful and people are doing a lot of cool stuffs with it and here are some of them:
1. JavaScript Information Visualization Toolkit (JIT)

The JIT comes with 4 tools based on some advanced information visualization techniques.
- RGraph – a radial layout of trees with advanced animations
- Treemaps – displaying large hierarchical structures on a constrained space
- Hyperbolic Trees – a focus+context information visualization technique used to display large amount of inter-related data
- Spacetree – expand nodes that are “context-related” in a common tree layout
Visit http://blog.thejit.org/javascript-information-visualization-toolkit-jit/ for more information and example.
2.
The Simile Project from MIT is focused on developing robust, open source tools that empower users to access, manage, visualize and reuse digital assets. The web widgets contains a toolbox of several Web widgets and APIs to do just that. Just to highlight 2 of them:
- Timeplot – plotting time series and overlay time-based events over them.

- Timeline - visualizing time-based events. It is like for time-based information.

Visit for more information and example.
3. MooWheel

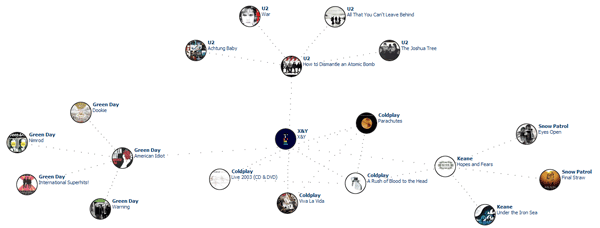
MooWheel provide a unique and elegant way to visualize data using Javascript and the <canvas> object. You can use it to display connections between many different objects, be them people, places, things, or otherwise.
Visit http://www.unwieldy.net/projects/moowheel/ for more information and example.
4.
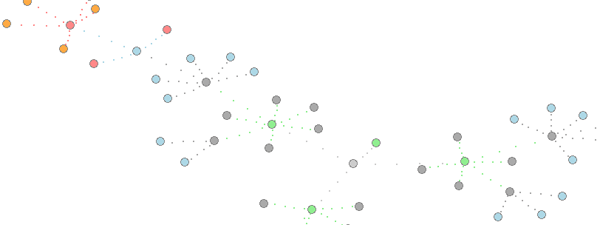
JSViz makes it easy to create dynamic 2D views of information including network graphs, navigation, and other dynamic layouts. Here are two example:
Visit for more information and example.
5. Chronoscope

Chronoscope is a smart, sophisticated and powerful visualizing tool. It is well tested on a large data points and provide an intuitive way to explore, annotate the data. There are four ways for you to use it:
- Widget - allow you to drop a chart into any web page.
- Microformats - understand data in your web page’s HTML
<table>data and they’re an easy way to add annotations and highlights to charts. - Javascript API - use javascript to modify your chart in place.
- GWT API – integration with your Google Web Toolkit application.
Visit http://timepedia.org/chronoscope/ for more information and example.
6. Processing.js

It is a port of Processing visualization language to JavaScript, using the Canvas element. So now you can use most of 2d Processing API. This includes all sorts of different methods:
- Shapes drawing
- Canvas manipulation
- Pixel utilities
- Image drawing
- Math functions
- Keyboard and mouse access
- Objects (point, arrays, random number generators)
- Color manipulation
- Font selection and text drawing
- Buffers
Visit http://ejohn.org/blog/processingjs/ for more information and example.
If you actually get to this far, then I guess you might already played some of the demos. As you can see, some of them are quite experimental and the performance are not great. But I am sure in a year’s time the browser will be come more powerful and we will see a lot more Javascript based visualizing tools being deployed on the web.


Comments so far
Excellent list. Thank you.
Richard cool stuff, thanks! Some of your links are bad. Look at moowheel and processing. You’ll figure it out
The Simile timeline & JIT toolkit is amazing, thanks for sharing.
Incredible the one that she can do.. I had forgotten, thank you.
The Magliozzis previously took a break at approximately the half-hour mark of the show. ,
Post a comment
Trackbacks/Pingbacks