Charts and Graphs Plotting with JQuery plugins
 Charts are important in visualising data to give a more profound understanding of the nature of given problem. A good charting solution for should render charts dynamically from raw data and allow multiple type of data presentation.
Traditionally we generate charts on the server-side but that means it will take up more bandwidth by the image all the way across the internet. Ideally we would just send the data to the browser and it will render the chart. With the advance in javascript and browser support, we have many powerful chart components out there based on Javascript. Now with the help of javascript frameworks, we can create charts in just a few lines of code.
Here we present you with 3 top jQuery plugins for plotting charts.
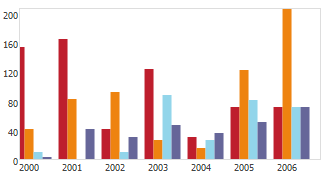
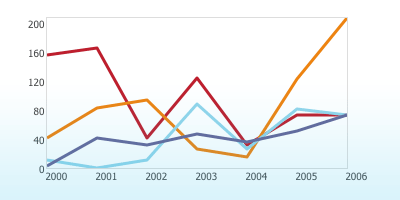
fgCharting

fgCharting is a simple plugin that provide you with 7 types of graphs such as line, bar, pie, filled lines. However, the special concept for this plugins is that it is accessible. It can read data from HTML table on the page and render them.
Website: Accessible_Charts_using_Canvas_and_jQuery
Download: fgCharting.jQuery.js
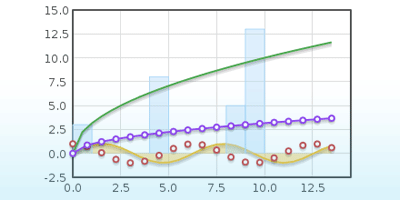
Flot

is a very powerful plotting library allowing you to create attractive and interactive graphical plots of arbitrary datasets on the fly. It has advance feature like zooming and highlighting but still easy to use.
Website:
Download:
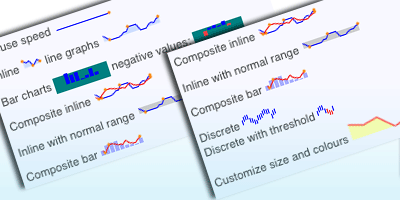
Sparklines

Sparkine allow you to generate small inline charts using data supplied either inline HTML or via javascript. It provide 6 types of charts such as line, bar, tristate, discrete, bullet or pie.
Website: jQuery Sparkine
Download: jquery.sparkline.js
Comments so far
Just noticed Flot was updated on Sept 25
Great summary of this Rich, I’d recommend you do a part 2 with some details of other libraries.
Cheers
Have you other examples related to Charts and Graphs with JQuery plugins ?
Have you heard about jqPlot? (www.jqplot.com)
It’s open source too and looks awesome!
Thank you for this very informative blog. I definitely want to explore these different types of sites for charts and graph plotting and make use of them on my monthly reports.
Post a comment
Trackbacks/Pingbacks